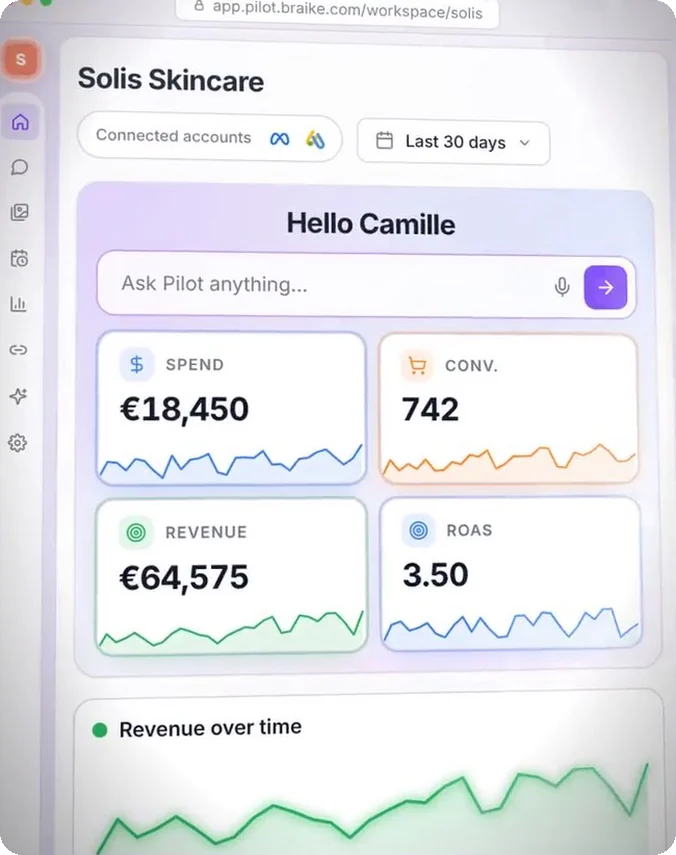
A custom dashboard, from one sentence.
Describe what you want to see. Pilot builds it with your data, updates it when you ask or at the time you choose, and you share it with a link.
Built with the numbers read from your accounts. Your client opens the link without an account.
- Meta Ads
- Google Ads
- TikTok Ads
- Google Analytics 4




From sentence to link
You describe
One sentence in the chat: what you want to see, over what period.
Pilot builds
KPIs, charts and a table, with the numbers from your accounts.
It updates
“Refresh” on demand, or “Automate” it every day or every Monday.
You share
“Copy link”: your client opens it without an account, view-only.
A client dashboard takes two hours. The next day, it's already wrong.
- 5exports before the first chartMeta, Google Ads, TikTok, the website, the store: every source has its own export, its own format and its own way of counting.
- 2 hof spreadsheets and formattingMerging, recalculating ROAS, rebuilding the charts, matching the client's colors, proofreading.
- D+1and the numbers have movedYou send a screenshot, then another one. The client no longer knows which one is right.
2 h: the assumption used in the production record for a dashboard built by hand.
One sentence, one dashboard: try it
The first dashboard is already here. Click one of the three sentences: it rebuilds before your eyes with Solis Skincare's numbers. Then share it and see what the client sees.




Solis Skincare
Facial skincare sold online. Meta, Google Ads and TikTok: €44,000 spent for 2,959 purchases from Sep 6 to Oct 5.
Four steps, one minute. Or pick a sentence right away.
What would you like to see? Pick a sentence: Pilot builds the dashboard with the Solis numbers.
Build me a dashboard: ROAS by platform, week by week.
- Reading your data
- Building the dashboard
ROAS by platform, week by week
Dashboard
ROAS by platform, week by week
Solis SkincareSep 6 → Oct 5
- Cost per purchase
- €14.87
- spend ÷ purchases
- Revenue
- €182,420
- Last 30 days
- Spend
- €44,000
- Meta, Google Ads, TikTok
- Purchases
- 2,959
- 99 a day
ROAS by week
The last 8 full weeks. Click a platform to hide it.
Spend by week
All platforms, in euros.
| Meta | €22,400 | €96,320 | 4.30 | 1,580 | €14.18 |
| Google Ads | €14,200 | €63,900 | 4.50 | 968 | €14.67 |
| TikTok | €7,400 | €22,200 | 3.00 | 411 | €18.00 |
| Total | €44,000 | €182,420 | 2,959 | €14.87 |
Sped-up demo: in Pilot, building takes a few minutes while Pilot reads your accounts.
You say what to look at. Pilot builds the dashboard.
Pilot reads your accounts, picks the charts that answer the question and builds a complete page in the conversation. The numbers come from your accounts, embedded at build time.
ROAS by platform, week by week
Solis SkincareSep 6 → Oct 5
- Cost per purchase
- €14.87
- spend ÷ purchases
- Revenue
- €182,420
- Last 30 days
- Spend
- €44,000
- Meta, Google Ads, TikTok
- Purchases
- 2,959
- 99 a day
ROAS by week
The last 8 full weeks.
7 days14 days30 daysReset
| Platform | Spend | Revenue | ROAS | Purchases | Cost / purchase |
|---|---|---|---|---|---|
| Google Ads | €14,200 | €63,900 | 4.50 | 968 | €14.67 |
| Meta | €22,400 | €96,320 | 4.30 | 1,580 | €14.18 |
| TikTok | €7,400 | €22,200 | 3.00 | 411 | €18.00 |
| Total | €44,000 | €182,420 | 2,959 | €14.87 |
Add the cost per purchase for each platform.
- A branded headerThe logo and the period. With “Brand design”, Pilot uses the client's colors, fonts and logos.
- The KPIs that matter, up topReadable without hovering: €182,420, 2,959 purchases, €14.87 per purchase.
- Charts you can readLines, bars, axes and legends, chosen for the question asked.
- Details to filter and sortA sortable table, filters for 7, 14 or 30 days, and “Reset”.
- Edited with a sentence“Add the cost per purchase.” “Switch to monthly.” Pilot updates the same dashboard and keeps its version history.
It updates. The link doesn't change.
Pilot rereads the account data and rebuilds the dashboard in place, when you click “Refresh” or at the time you schedule with “Automate”. Nothing to redo by hand.
Automate
Schedule this deliverable to be regenerated with fresh data. Choose a frequency:
Every day · 07:00Next: Wednesday, Oct 7 at 07:00. Pilot rereads the Solis accounts and regenerates the dashboard in place: the link you already sent still works.
History
Updated with the latest dataShowing
Tue, Oct 6, 07:00
Dashboard created
Mon, Oct 5, 10:12
If an update fails: “The last update failed. The figures below are from the previous version, which is still valid.”
- “Refresh”Runs a full new analysis on the account data: expect 3 to 6 minutes, and you can leave the page in the meantime.
- “Automate”Every day, Monday to Friday, every Monday, every Friday or twice a day, at the time you choose.
- Same link, new versionThe link you already sent still works. The history keeps the previous versions.
- Nothing breaks silentlyIf an update fails, the previous version stays on screen, with a banner that says so.
One link, and your client has their dashboard
Click “Share”, then “Copy link”: that's it. Your client opens it in their browser, on their phone or in a meeting, without a Pilot account.
Share “ROAS by platform, week by week”
Add people by email
People with access
- Camille Roy (you)camille@agence.exampleOwner
- lea@solis.exampleViewer
Workspace members always have access to this artifact.
General access
Restricted
Anyone with the link
Shared by Solis Skincare · updated Oct 6, 2026
ROAS by platform, week by week
Solis SkincareSep 6 → Oct 5
7 days14 days30 daysReset
- Cost per purchase
- €14.87
- spend ÷ purchases
- Revenue
- €182,420
- Last 30 days
- Spend
- €44,000
- Meta, Google Ads, TikTok
- Purchases
- 2,959
- 99 a day
- No account neededAnyone with the link can view the dashboard.
- View-onlyThey can filter the tables and export them to CSV or Excel. They can't change anything.
- Always the latest versionThe link follows every update: no more screenshots to resend.
- You stay in controlSwitch access to “Restricted” and the link no longer opens. Or add people by email, as Viewer.
One folder per client, and every dashboard in its place
File your dashboards in folders and sub-folders: one per client, per brand or per topic.
Folders
9 dashboards
Folders › Solis Skincare › Weekly
- DashboardWeeklyCost per purchase by campaign“Build me a dashboard: cost per purchase for each campaign, alert above €20.”Created just now
- ROAS by platform, week by weekUpdated Oct 6
Conversations
Cost per purchase for each campaign, alert above €20
Share the folder “Solis Skincare”
Sharing applies to every dashboard in the folder and its sub-folders, including those filed later.
lea@solis.exampleViewer
General access
RestrictedOnly workspace members and people added can open it.
- Folders and sub-foldersUp to three levels. “Move to” files a dashboard, and deleting a folder never deletes one.
- Filed automaticallyA dashboard created in a filed conversation lands in the dashboard folder with the same name.
- Folders can be shared tooSharing covers every dashboard in the folder, including those filed later.
Sentences that work, ready to use as is
Copy a sentence, paste it into Pilot's chat, change the period or the platform. The dashboard follows.
- Performance
ROAS by platform, week by week, over the last 8 weeks.
Four KPIs, one line per platform, the details in a table.
- Budget
Spend vs. monthly target, with the end-of-month projection.
The spending pace, the projection, and an alert if it drifts.
- Campaigns
Cost per purchase for each campaign, in red above €20.
Campaigns ranked, with the threshold in plain sight.
- Ads
The 10 ads that spent the most this month, with their cost per purchase.
Where the money goes, ad by ad.
- Website
GA4 sessions and purchases, day by day, next to Meta spend.
Your ads and your website on the same timeline.
- Comparison
This month vs. last month, platform by platform.
The differences in euros and in percent, no spreadsheet needed.
- Search
Google Ads keywords that have spent without converting over the last 30 days.
The list to cut, sorted by spend.
- Client
The monthly review for Solis: KPIs, highlights, platform by platform.
A dashboard ready to send before the meeting.
A great dashboard becomes a template
The same dashboard, for another client
“Send this dashboard to another workspace”, then, in that workspace, “Generate with my data”: Pilot rebuilds it with that workspace’s numbers.
Received templateGenerate with my data
Before your first dashboard
The data from the accounts connected to Pilot: Meta, Google Ads, TikTok, and your other sources such as Google Analytics 4, Search Console or Merchant Center. The dashboard embeds the numbers read from your accounts when it was built; Pilot's instructions forbid it to make any up.
A few minutes: Pilot reads your accounts before writing the dashboard. An update with the latest data usually takes 3 to 6 minutes, and you can leave the page in the meantime.
No. Anyone with the link can view the dashboard. To cut off access, set General access to “Restricted”: only workspace members and people you've added can open it.
No. They can filter and export the tables. Refreshing, sharing and the history are reserved for the members of your workspace.
“Refresh” reruns the analysis whenever you want. “Automate” schedules the update: every day, Monday to Friday, every Monday, every Friday or twice a day. The dashboard is regenerated in place: the link doesn't change.
Yes. Enter their colors, fonts and logos under “Brand design” in their workspace settings: Pilot uses them for its dashboards and reports.
A flat fee of €225 excl. VAT per month, one ad account included, then a per-account price that decreases with volume. Connections to the Google and Microsoft suites are not billed. Full details are on the Pricing page.
Your next dashboard fits in one sentence.
Start the 7-day free trial, no credit card required. Connect a Meta, Google Ads or TikTok account, wait for the first collection to finish, then write one sentence in the chat: a few minutes later, your first dashboard is ready to share.
The demo uses a fictional brand, Solis Skincare. Its visuals are generated and its numbers are made up.
Pilot's other features
Each of Pilot's many features comes with its own video, demo and detailed explanation.